
Stephanie Leong
complete
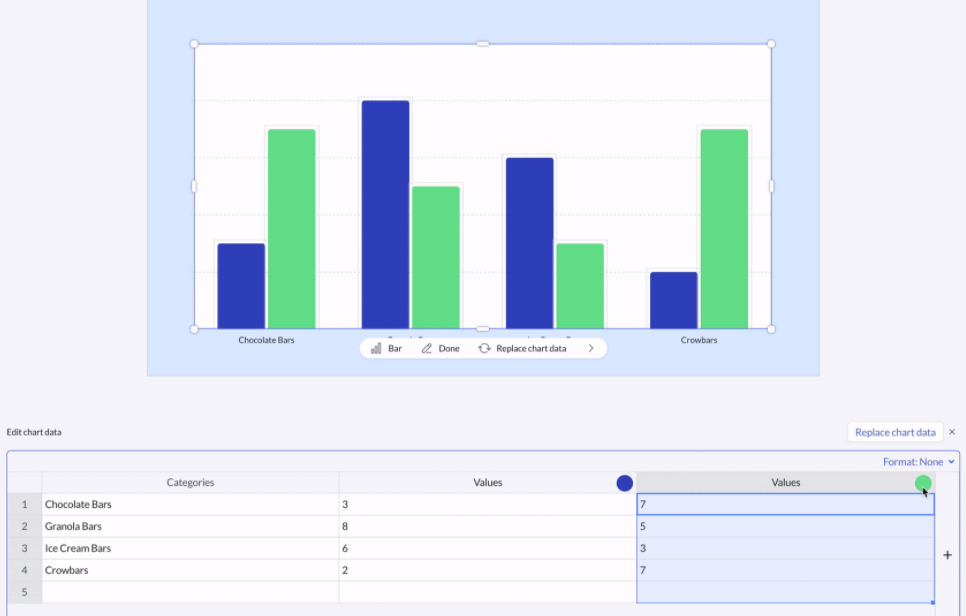
Hey there, we just launched multi-column chart support in Pitch!
Now you can add up to 8 columns of data to bar & line charts, so you can compare, contrast, & decide. To change the color of a column, click the color circle in the top right of each row. ✨
J
Janis Muench
Stephanie Leong: Hi Stephanie, so great that you are making progress with this!
What I need, however, is DIFFERENT data types for each column.
To give you an example, I want to show EBITDA (in $ or €) and EBITDA margin in percent in one chart. A very typical business chart.
Thanks a lot, great to see this big step forward. I hope to see this soon :)
Daniel Olshansky
💯 if this were implemented. Then I wouldn't have to use both Pitch and Figma. If a double bar graph was supported, it would solve 80% of my missing use cases. With that being said, I wanted to add a few additional personal feature requests:
- Having the option to have a more than double (maybe limit it?) bar graph would be awesome.
- For a double bar graph, would we have the option of having different y-axis (left and right value)?
- Add the ability to add bar and axis subtitles.
Aryaman Mandhana
Much needed. This is the only barrier for us to fully migrate to Pitch at this point.
R
Roxane Hassler
in progress